【学习总结】雅思写作
Lesson 1- overview
Just remember task 1 is to describe what you see. Don’t give any opinions. So write a summary(overview) instead of conclusion.
- Question Types
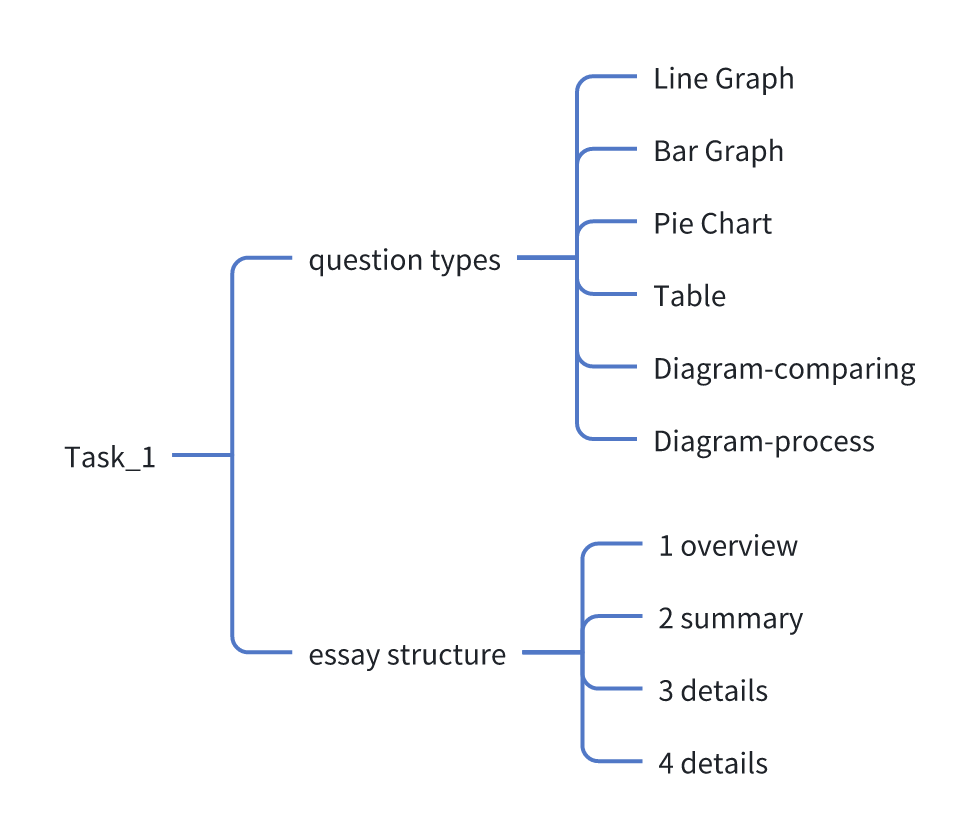
The question types can be defined into six types: line graph、bar chart、pie chart、table、diagram-comparing、diagram-process(map questions are included in diagrams). And the first four types have one thing in common, that they all show numbers. What you should do is just to describe one specific number, to compare some numbers and to describe the trends/changes. However, the fifth type is almost similar except description of the number.
- Essay Structure
The four paragraphs structure.
- Introduction – Paraphrase the question
- Summary – The main, general things
- Details
- Details
Lesson 2 - line graph
It shows the number changing over a period of time.
First, make a very general comparison. Such as higher overall
Second, compare the lines at specific points.
Example:

The graph below shows electricity production (in terawatt hours) in France between 1980 and 2012.
Introduction
The line graph compares the amount of electricity produced in France using four different sources of power over a period of 32 years.
It is clear that nuclear power was by far the most important means of electricity generation over the period shown. Renewables provided the lowest amount of electricity in each year.
In 1980, thermal power stations were the main source of electricity in France, generating around 120 terawatt hours of power. Nuclear and hydroelectric power stations produced just under 75 terawatt hours of electricity each, and renewables provided a negligible amount. Just one year later, nuclear power overtook thermal power as the primary source of electricity.
Between 1980 and 2005,electricity production from nuclear power rose dramatically to a peak of 430 terawatt hours. By contrast,the figure for thermal power fell to only 50 terawatt hours in 1985,and remained at this level for the rest of the period. Hydroelectric power generation remained relatively stable,at between 50 and 80 terawatt hours,for the whole 32-year period,but renewable electricity production saw only a small rise to approximately 25 terawatt hours by 2012.
amount of electricity produced
source of provided generating
means of electricity generation
over a period of /over the period shown
by far the most important
a negligible amount
nuclear power overtook thermal power
as the primary source of electricity
rose dramatically to a peak of
by contrast
the figure for
remained at this level,remained stable
saw only a small rise